CellDesigner.org

Simulation Example 2:Minimal Mitotic Oscillator

Here we try to simulate the Minimal Mitotic Oscillator model taken from SBML model repository.
http://sbml.org/models/Models-published/CellCycle-1998Gar/CellCycle-1998Gar.html
Take an SBML file from the repository, modify it on CellDesigner, then conduct simulation via CellDesigner's Simulation menu.

Model to simulate

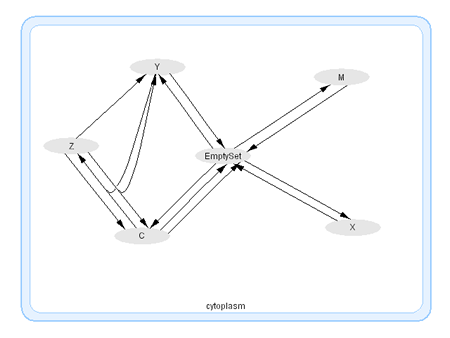
This is a modification of the widely cited Goldbeter (1991) minimal (3-variable) model for a mitotic oscillator. The three variables represent Cyclin ( C), inactive cdc-2 Kinase (M), and an active cdc-2 Kinase (X). Two additional variables Y, Z control the dynamics of the inhibitor.

Reference:

Gardner TS, Dolnik M, Collins JJ. A theory for controlling cell cycle dynamics using a reversibly binding inhibitor. PNAS 95: 14190-14195 (1998).

Model file (CellDesigner 2.0) to download

Simulation Step by Step

1. Set the value and formulas

  1. "Species" list: Set the initial value
    type
    positionTo
    Compartment
    id
    name
    compartment
    quantity type
    initial
    Quantity
    substance
    Units
    spatial
    SizeUnits
    hasOnly
    SubstanceUnits
    b.c.
    charge
    constants
    UNKNOWN inside EmptySet EmptySet cytoplasm Amount 0 FALSE TRUE 0 FALSE
    UNKNOWN inside C C cytoplasm Amount 0 FALSE FALSE 0 FALSE
    UNKNOWN inside M M cytoplasm Amount 0 FALSE FALSE 0 FALSE
    UNKNOWN inside X X cytoplasm Amount 0 FALSE FALSE 0 FALSE
    UNKNOWN inside Y Y cytoplasm Amount 1 FALSE FALSE 0 FALSE
    UNKNOWN inside Z Z cytoplasm Amount 1 FALSE FALSE 0 FALSE
  2. Set the Kinetic Law at "math" column in "Raction" list.
    type
    id
    name
    reversible
    fast
    reactants
    products
    modifiers
    math
    STATE_TRANSITION Reaction1 Reaction1 FALSE FALSE EmptySet C vi
    STATE_TRANSITION Reaction2 Reaction2 FALSE FALSE C EmptySet C*kd
    STATE_TRANSITION Reaction3 Reaction3 FALSE FALSE C EmptySet C*vd*X/(C+kd)
    STATE_TRANSITION Reaction4 Reaction4 FALSE FALSE EmptySet Y VS
    STATE_TRANSITION Reaction5 Reaction5 FALSE FALSE Y EmptySet d1*Y
    STATE_TRANSITION Reaction6 Reaction6 FALSE FALSE C,Y Z a1*C*Y
    STATE_TRANSITION Reaction7 Reaction7 FALSE FALSE Z C,Y a2*Z
    STATE_TRANSITION Reaction8 Reaction8 FALSE FALSE Z Y Z*alpha
    STATE_TRANSITION Reaction9 Reaction9 FALSE FALSE Z C Z*alpha
    STATE_TRANSITION Reaction10 Reaction10 FALSE FALSE EmptySet M (1-M)*VM1*C/(1+K1-M)*(Kc+C)
    STATE_TRANSITION Reaction11 Reaction11 FALSE FALSE EmptySet X VM3*(1-X)*M/(1+K3-X)
    STATE_TRANSITION Reaction12 Reaction12 FALSE FALSE M EmptySet M*V2/(K2+M)
    STATE_TRANSITION Reaction13 Reaction13 FALSE FALSE X EmptySet V4*X/(K4+X)
  3. Set the Parameters
    scope
    id
    name
    value
    units
    constant
    local:Reaction(Reaction1) vi 0.025 TRUE
    local:Reaction(Reaction2) kd 0.01 TRUE
    local:Reaction(Reaction3) kd 0.01 TRUE
    local:Reaction(Reaction3) vd 0.25 TRUE
    local:Reaction(Reaction4) VS 0 TRUE
    local:Reaction(Reaction5) d1 0.05 TRUE
    local:Reaction(Reaction6) a1 0.5 TRUE
    local:Reaction(Reaction7) a2 0.5 TRUE
    local:Reaction(Reaction8) alpha 0.1 TRUE
    local:Reaction(Reaction9) alpha 0.1 TRUE
    local:Reaction(Reaction10) K1 0.005 TRUE
    local:Reaction(Reaction10) Kc 0.3 TRUE
    local:Reaction(Reaction10) VM1 3 TRUE
    local:Reaction(Reaction11) K3 0.005 TRUE
    local:Reaction(Reaction11) VM3 1 TRUE
    local:Reaction(Reaction12) K2 0.005 TRUE
    local:Reaction(Reaction12) V2 1.5 TRUE
    local:Reaction(Reaction13) K4 0.005 TRUE
    local:Reaction(Reaction13) V4 0.5 TRUE

2. Run Simulator

  1. Select "Simulation" - "Control Panel " menu of CellDesigner.
    The ControlPanel screen appears.
  2. Set [End Time] and [Number of Points].
  3. Click [Execute] button at the bottom.

    You can also conduct "change initial quantities of the species and parameters ", "change amount at the specific time for simulation", "parameter scan", "interactive simulation" on the Control Panel.
  4. To save the plot image, select [File]-[Save Image/Print] menu of the ControlPanel.
    The Image Config Dialog window will appear.
  5. Click [Config] button to specify the detail appearance of the plot image, such as title, legend and background colors.
  6. Click [Save Image]. The image can be saved in BMP, PNG, TIFF, PNM, and JPEG.
  7. Click [Print] to print the image as specified.


About Us | Site Map | Privacy Policy | Contact Us | ©2004 The Systems Biology Institute. All rights reserved.