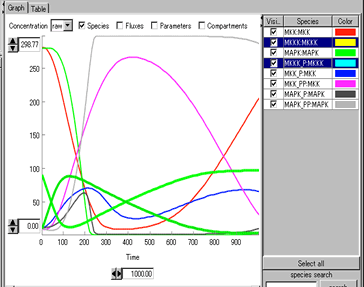
To highlight a Species in the Graph area:
- In the Control Panel, click Graph tab.
- Click a cell in the Species column in the table.
- The corresponding line in the Graph will be highlighted.
- Next, click on a line in the Graph.
- The corresponding table row on the right panel will be highlighted.

To show/hide Species displayed in the Graph area:
- In the Control Panel, click Graph tab.
- Select/unselect checkboxes in the Visible column in the right panel.
- The checked Species are displayed/hidden on the Graph.

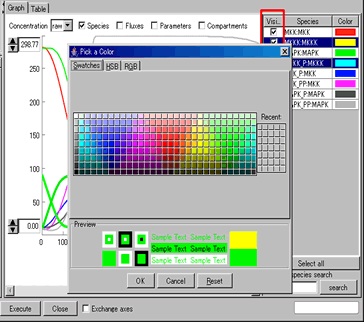
To change the line color of the graph:
- In the Control Panel, click Graph tab.
- Click a cell in the Color column on the right panel.
- Pick a Color dialog appears.
- Select a color and click the OK button.


